


Google Analytics can be daunting, especially if you haven’t had any interaction with the platform before. There are endless reports you can run, as well as multiple menus and tabs to navigate through. This quick guide will give you a run down of some basic reports, as well as how to set up Google Analytics.
Before you start
Before diving into your Google Analytics reports, there are a few important points to take into consideration.
- Always ensure you are using the correct view to analyse your data.
- Remember to set the date you want to analyse data for.
Audience Reports
Demographics
To find out the demographics of your visitors, such as age and gender navigate to Audience > Demographics > Overview. This will give you a basic overview of the data. You can analyse different data such as Users, Session and Bounce Rate by selecting from the Key Metric dropdown.
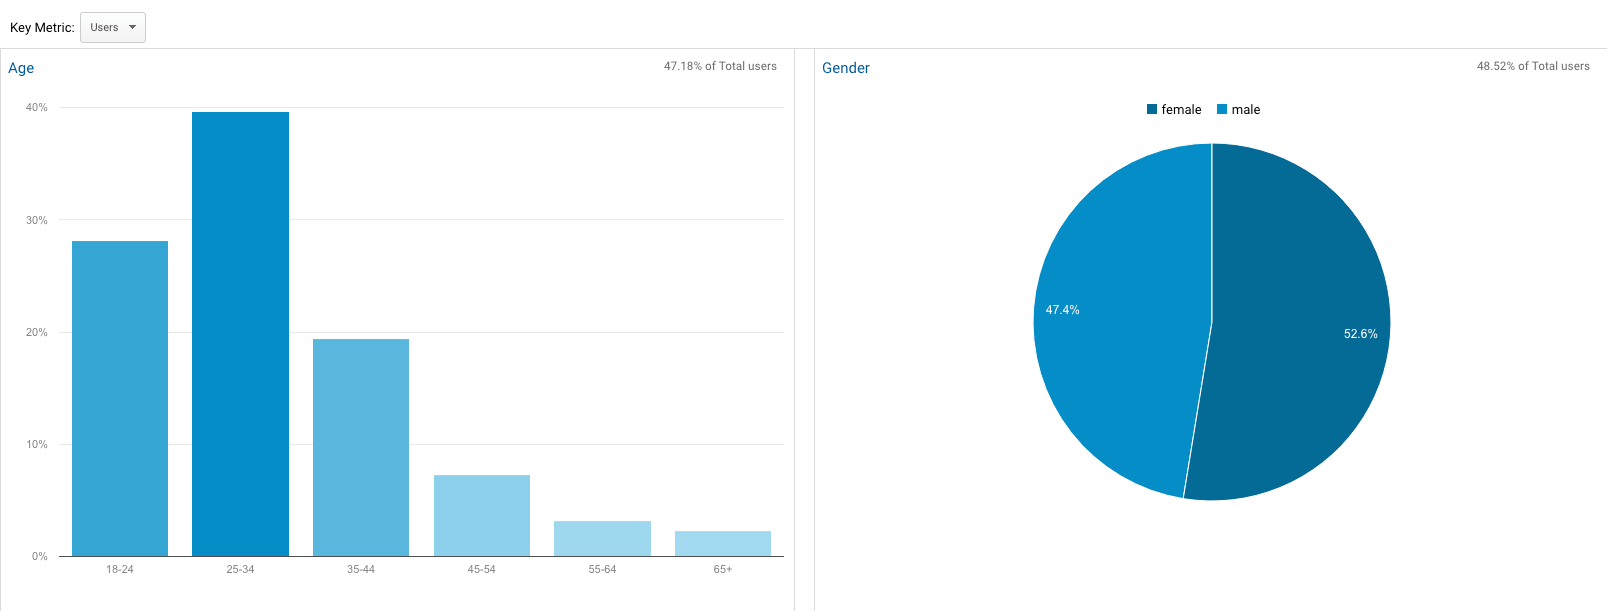
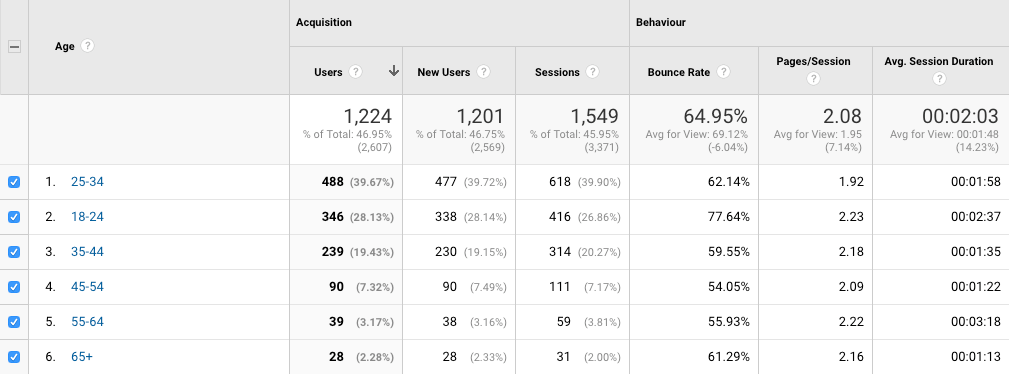
You can drill down further into the data by navigating to Audience > Demographics > Age or Audience > Demographics > Gender.
These views will show you further data. For example, Number of Users, New Users, Sessions, etc. of all of the different age groups or genders.
Geo
To find out the languages and locations of your visitors navigate to Audience > Geo > Language or Audience > Geo > Location.
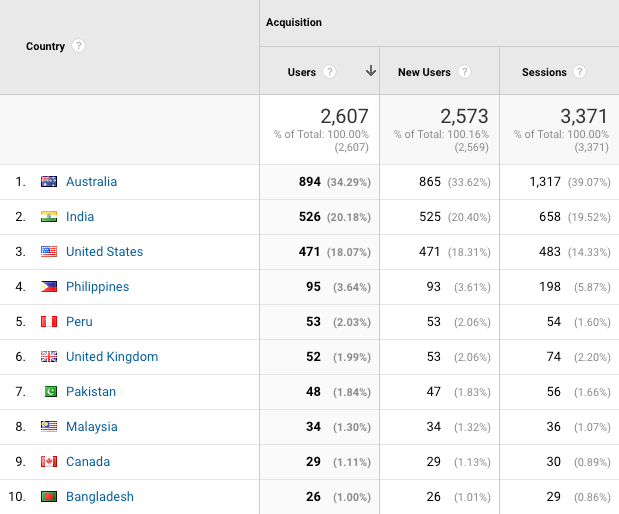
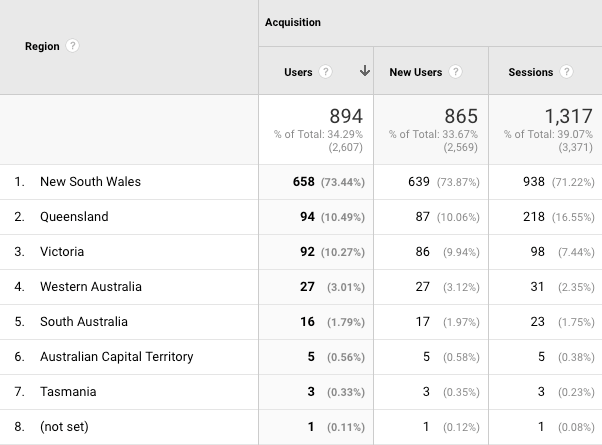
You can drill down further into the data by clicking on each Country. You will then get data by Region.
Behaviour
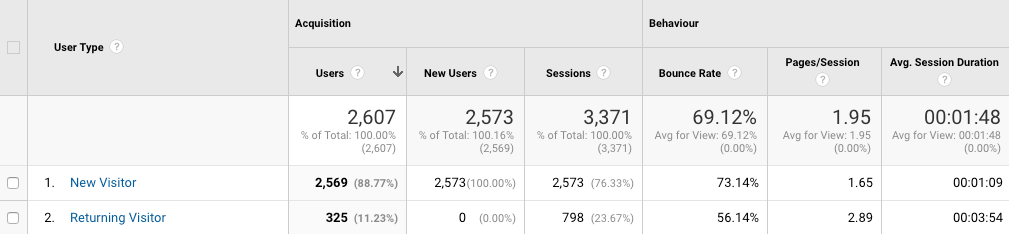
To analyse user behaviour such as New vs. Returning users, navigate to Audience > Behaviour > New vs. Returning.
Technology
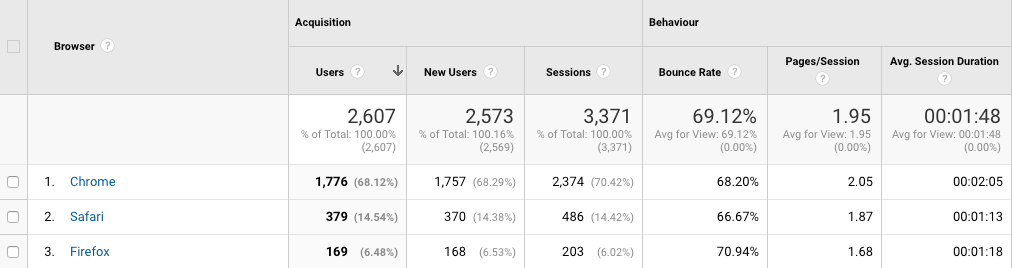
To find out what Browser and Operating System your visitors are using navigate to Audience > Technology > Browser & OS.
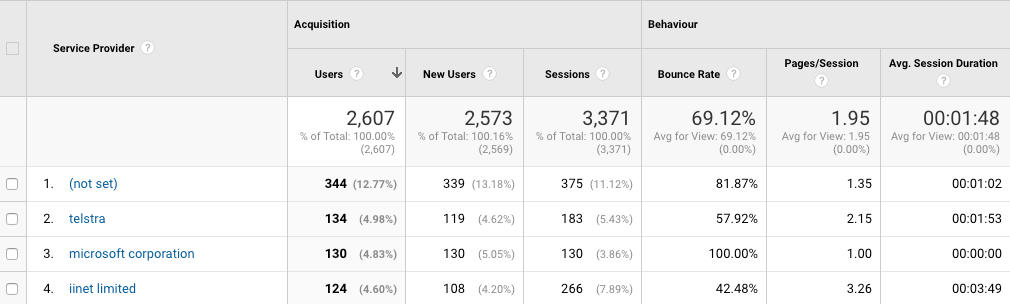
To find out what Network your visitors are using navigate to Audience > Technology > Network.
Mobile
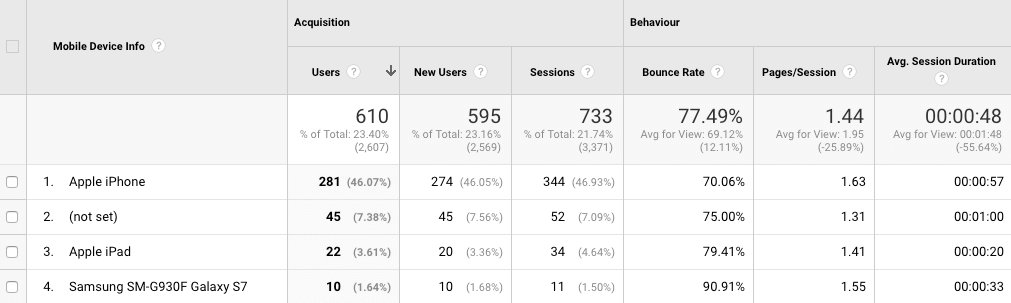
If you want to know which Devices your visitors are using navigate to Audience > Mobile > Overview.
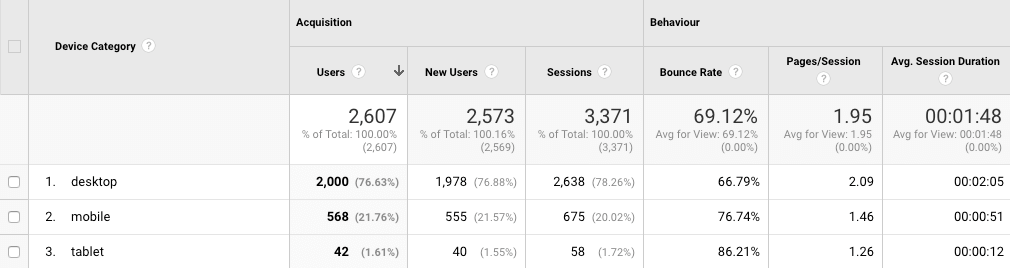
The specific device type can be found by navigating to Audience > Mobile > Devices.
Acquisition Reports
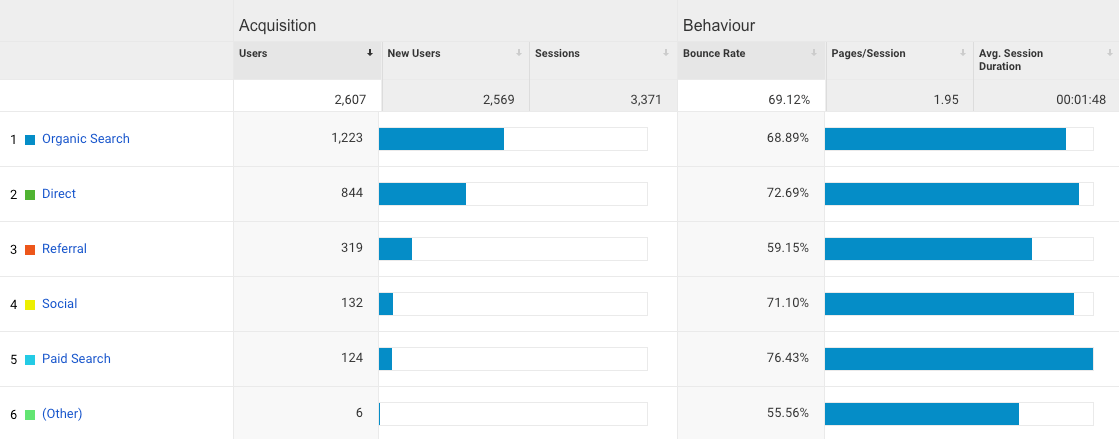
To find out where your visitors originated from or came from, you will look at the Acquisition Reports. This data can help you determine which marketing tactics are bringing in your visitors such as search engines, social channels or website referrals.
To get a basic over of this data navigate to Acquisition > Overview. Here you will see a breakdown of Organic Search, Direct, Email, Social, etc.
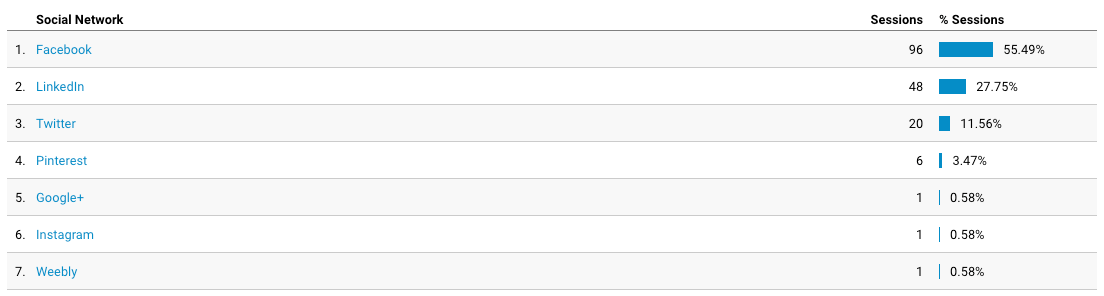
Social
To find out which Social Networks bring in the most traffic to your website navigate to Acquisition > Social > Overview.
Behaviour Reports
The Behaviour Reports help you see the behaviours of your website visitors.
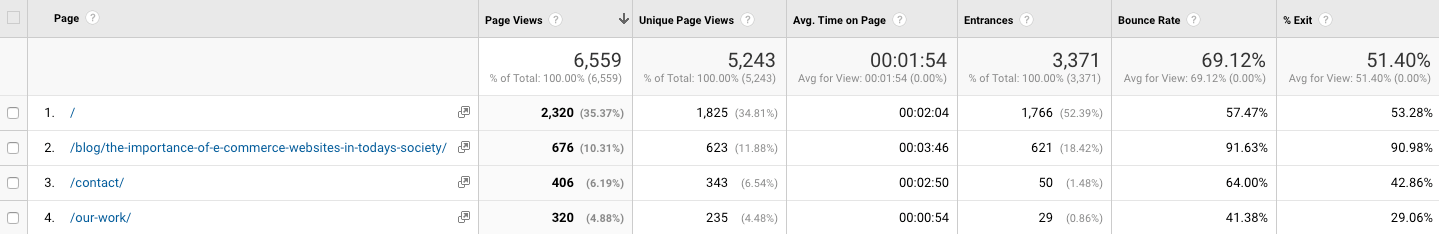
All Pages
To view the top performing content on your website navigate to Behaviour > Site Content > All Pages. This will display the top pages on your website in terms of page views, average time they spent on the page, bounce rate etc.
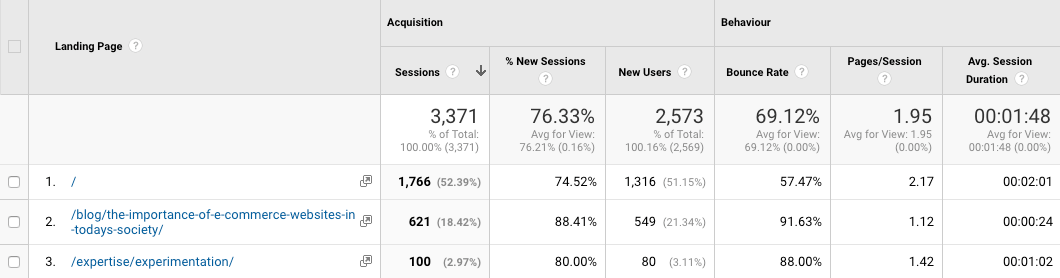
Landing Pages
The Landing Pages reports shows you which page a visitor entered the website. This data can be helpful as it can tell you the pages which can help you generate the most leads or conversions. To find this data navigate to Behaviour > Site Content > Landing Pages.
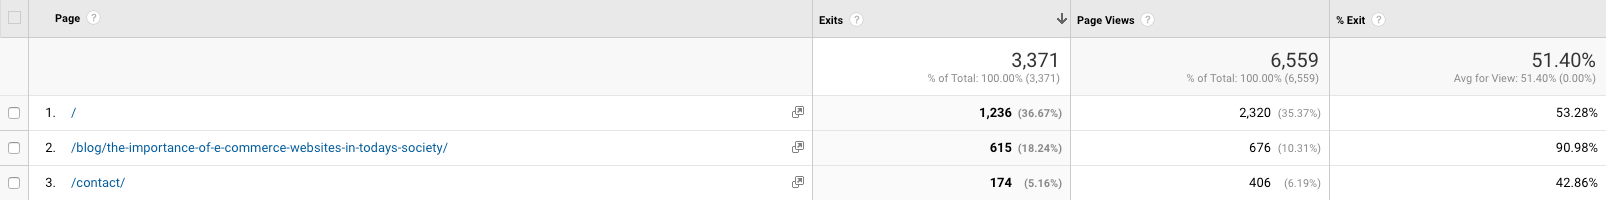
Exit Pages
To see which page a user last visited before leaving your website navigate to Behaviour > Site Content > Exit Pages.
Conversions
The Conversions report tells you how many Conversions have happened on your website.
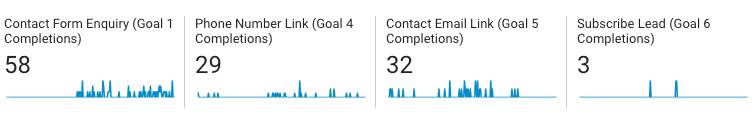
Goals
Specific Goals can be set up to track certain actions on your website. For example:
- Contact Form Completions
- Phone Number Link Clicks
- Email Link Actions
To view this data navigate to Conversions > Goals > Overview. This report will tell you how many Goal Completions you have had.
Configuring goals!
Learn how to set up a Contact Form Completion Goal. For this to work correctly, your website will need to be configured for users to be redirected to a Thank You page after the Contact Form has been submitted.
- Navigate to Admin > Goals
- Click + New Goal
- In Goal set-up select Custom then Continue
- In Goal description give your Goal a name. I.e. “Contact Us Conversions”
- Under Type, select Destination then Continue
- In Goal details select your destination as Begins with
- Enter the Thank You page URL. I.e. /thank-you/
- Select Save
If You Don’t Have Google Analytics
Don’t sweat it, we’ve got you covered for that as well.
Setting up Google Analytics
To set up a Google Analytics account:
- You will first need a Google account . Navigate to https://accounts.google.com/
- To create an account click Sign up.
- Once you have created your Google account, navigate to https://analytics.google.com/
- Select Sign up.
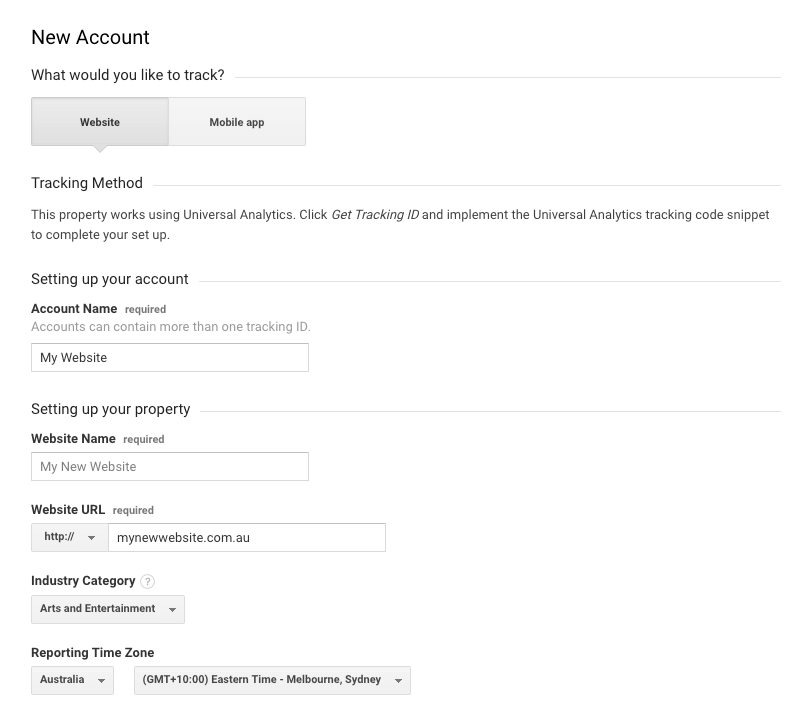
- To track your website, select Website.
- Input your Account Name. This can be the name of your company or website.
- Input your Website Name and your Website URL. Be sure to include the correct protocol. HTTP or HTTPS.
- Select your Industry Category.
- Select your Time Zone.
- Choose the Data Sharing options you wish to use.
- Once finished, select Get Tracking ID.
- In the next screen you will need to accept the terms of service for your specific country.
- Select your country, read the terms and click I agree if you are happy with the terms.
- You will then be directed to your Tracking ID and Code to be implemented on your website. (This can be sent to your digital marketing agency or developer to implement).
Google Analytics views
There are 3 views for a successful Google Analytics account. (Your digital agency can set these up for you).
Main View
The Main View is the view where you do almost all of your analysis and reporting. It is the “go to” View. Main View can be setup to filter out internal traffic and ghost spam as well as any other filters your website needs.
Raw View Data
A Raw Data View is a Google Analytics View with no configuration. For example, no filters are applied. The Raw Data View acts as a back-up.
Test View
The Test View should be the same as the Main View, except this is where you do your testing for changes that you want to implement in the Main View but that would permanently affect the data.